How to get statistics from EDP dialogues
1. Open the EDP tool
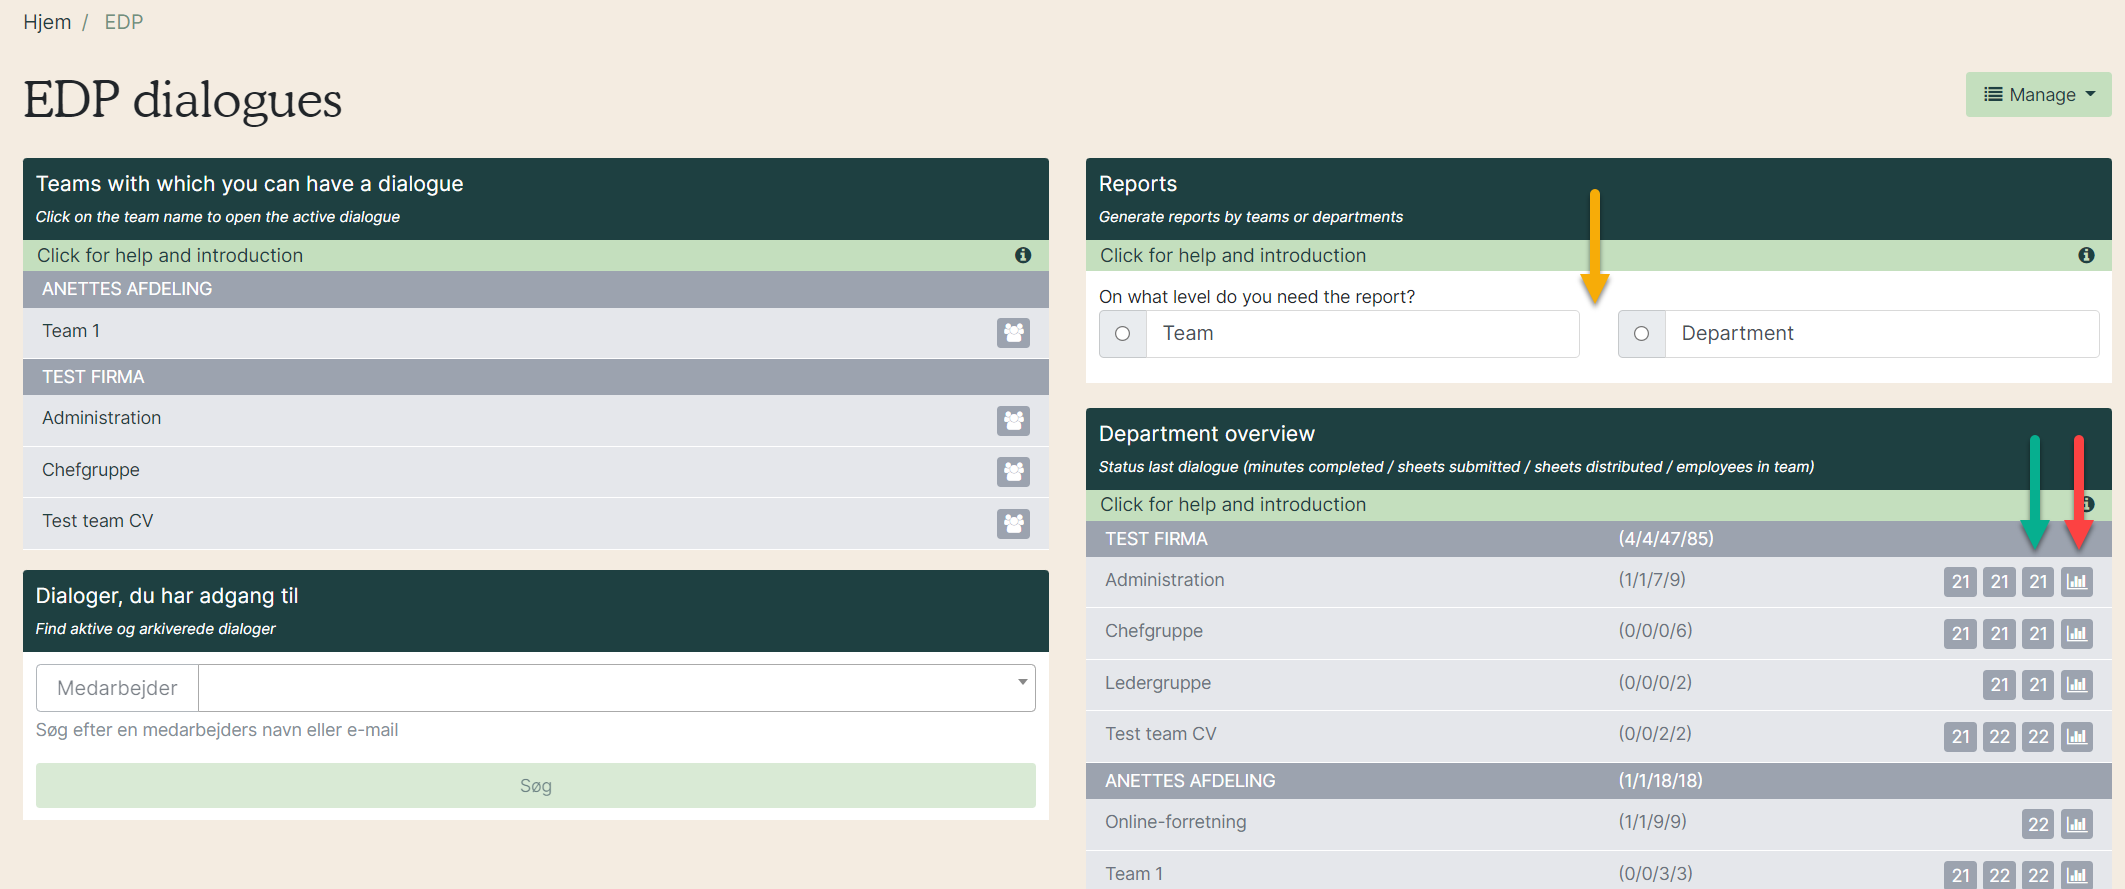
Go to the EDP tool, where there are several options for statistical reports.
- Yellow arrow: Advanced statistics with filters.
- Green arrow: PDF statistic for specific dialogue round.
- Red arrow: PDF aggregated statistics from the EDP of the last three years.

2. Data for the report
The advanced statistics gives the following options:
- Blue arrows: Choose level for the report - team or department.
- Red arrow: Choose team or department. You can choose several for comparison.
- Purple arrow: Choose a year or latest round of dialogue. Rounds are only possible for team reports.
- Yellow arrow: Choose specific questions for the statistic if necessary. If you want all questions in the report, do not choose anything here.
- Green arrow: Choose if the organisation’s average should be included or not.
Finish by clicking ” Generate PDF”.

3. Generate the report
At the top right, notifications appear while the report is being generated and when it is ready for download.

When the report is ready, it can be downloaded by clicking on the link that says Download. The report will also be saved under "My reports".

4. Open the report
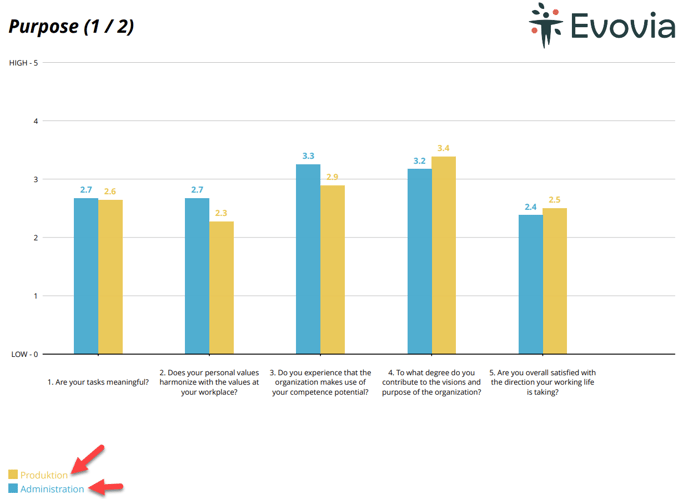
The report shows a graph with the average of each question by team or department depending on what you have chosen.
This example shows the selected teams next to each other with different colors (red arrows).

5. Distribution of scores
The last pages in the PDF show the distribution of answers; how many have scored which values.
The yellow arrow shows the scores from 0-5.
The green arrow shows how many people have scored the different values. 2 people have scored 1 and 4 people have scored 5 on the first question.
27 people have answered the question.
